Between 2021 and 2023, I worked with Dr. Jay Kikkawa at the University of Pennsylvania to model and develop a method for producing laser beams with high purity orbital angular momentum (OAM). Our work resulted in the following publication:
Sontag, A., Noyan, M., & Kikkawa, J. (2022). High purity orbital angular momentum of light. Optics Express 30(24), 43513-43521.

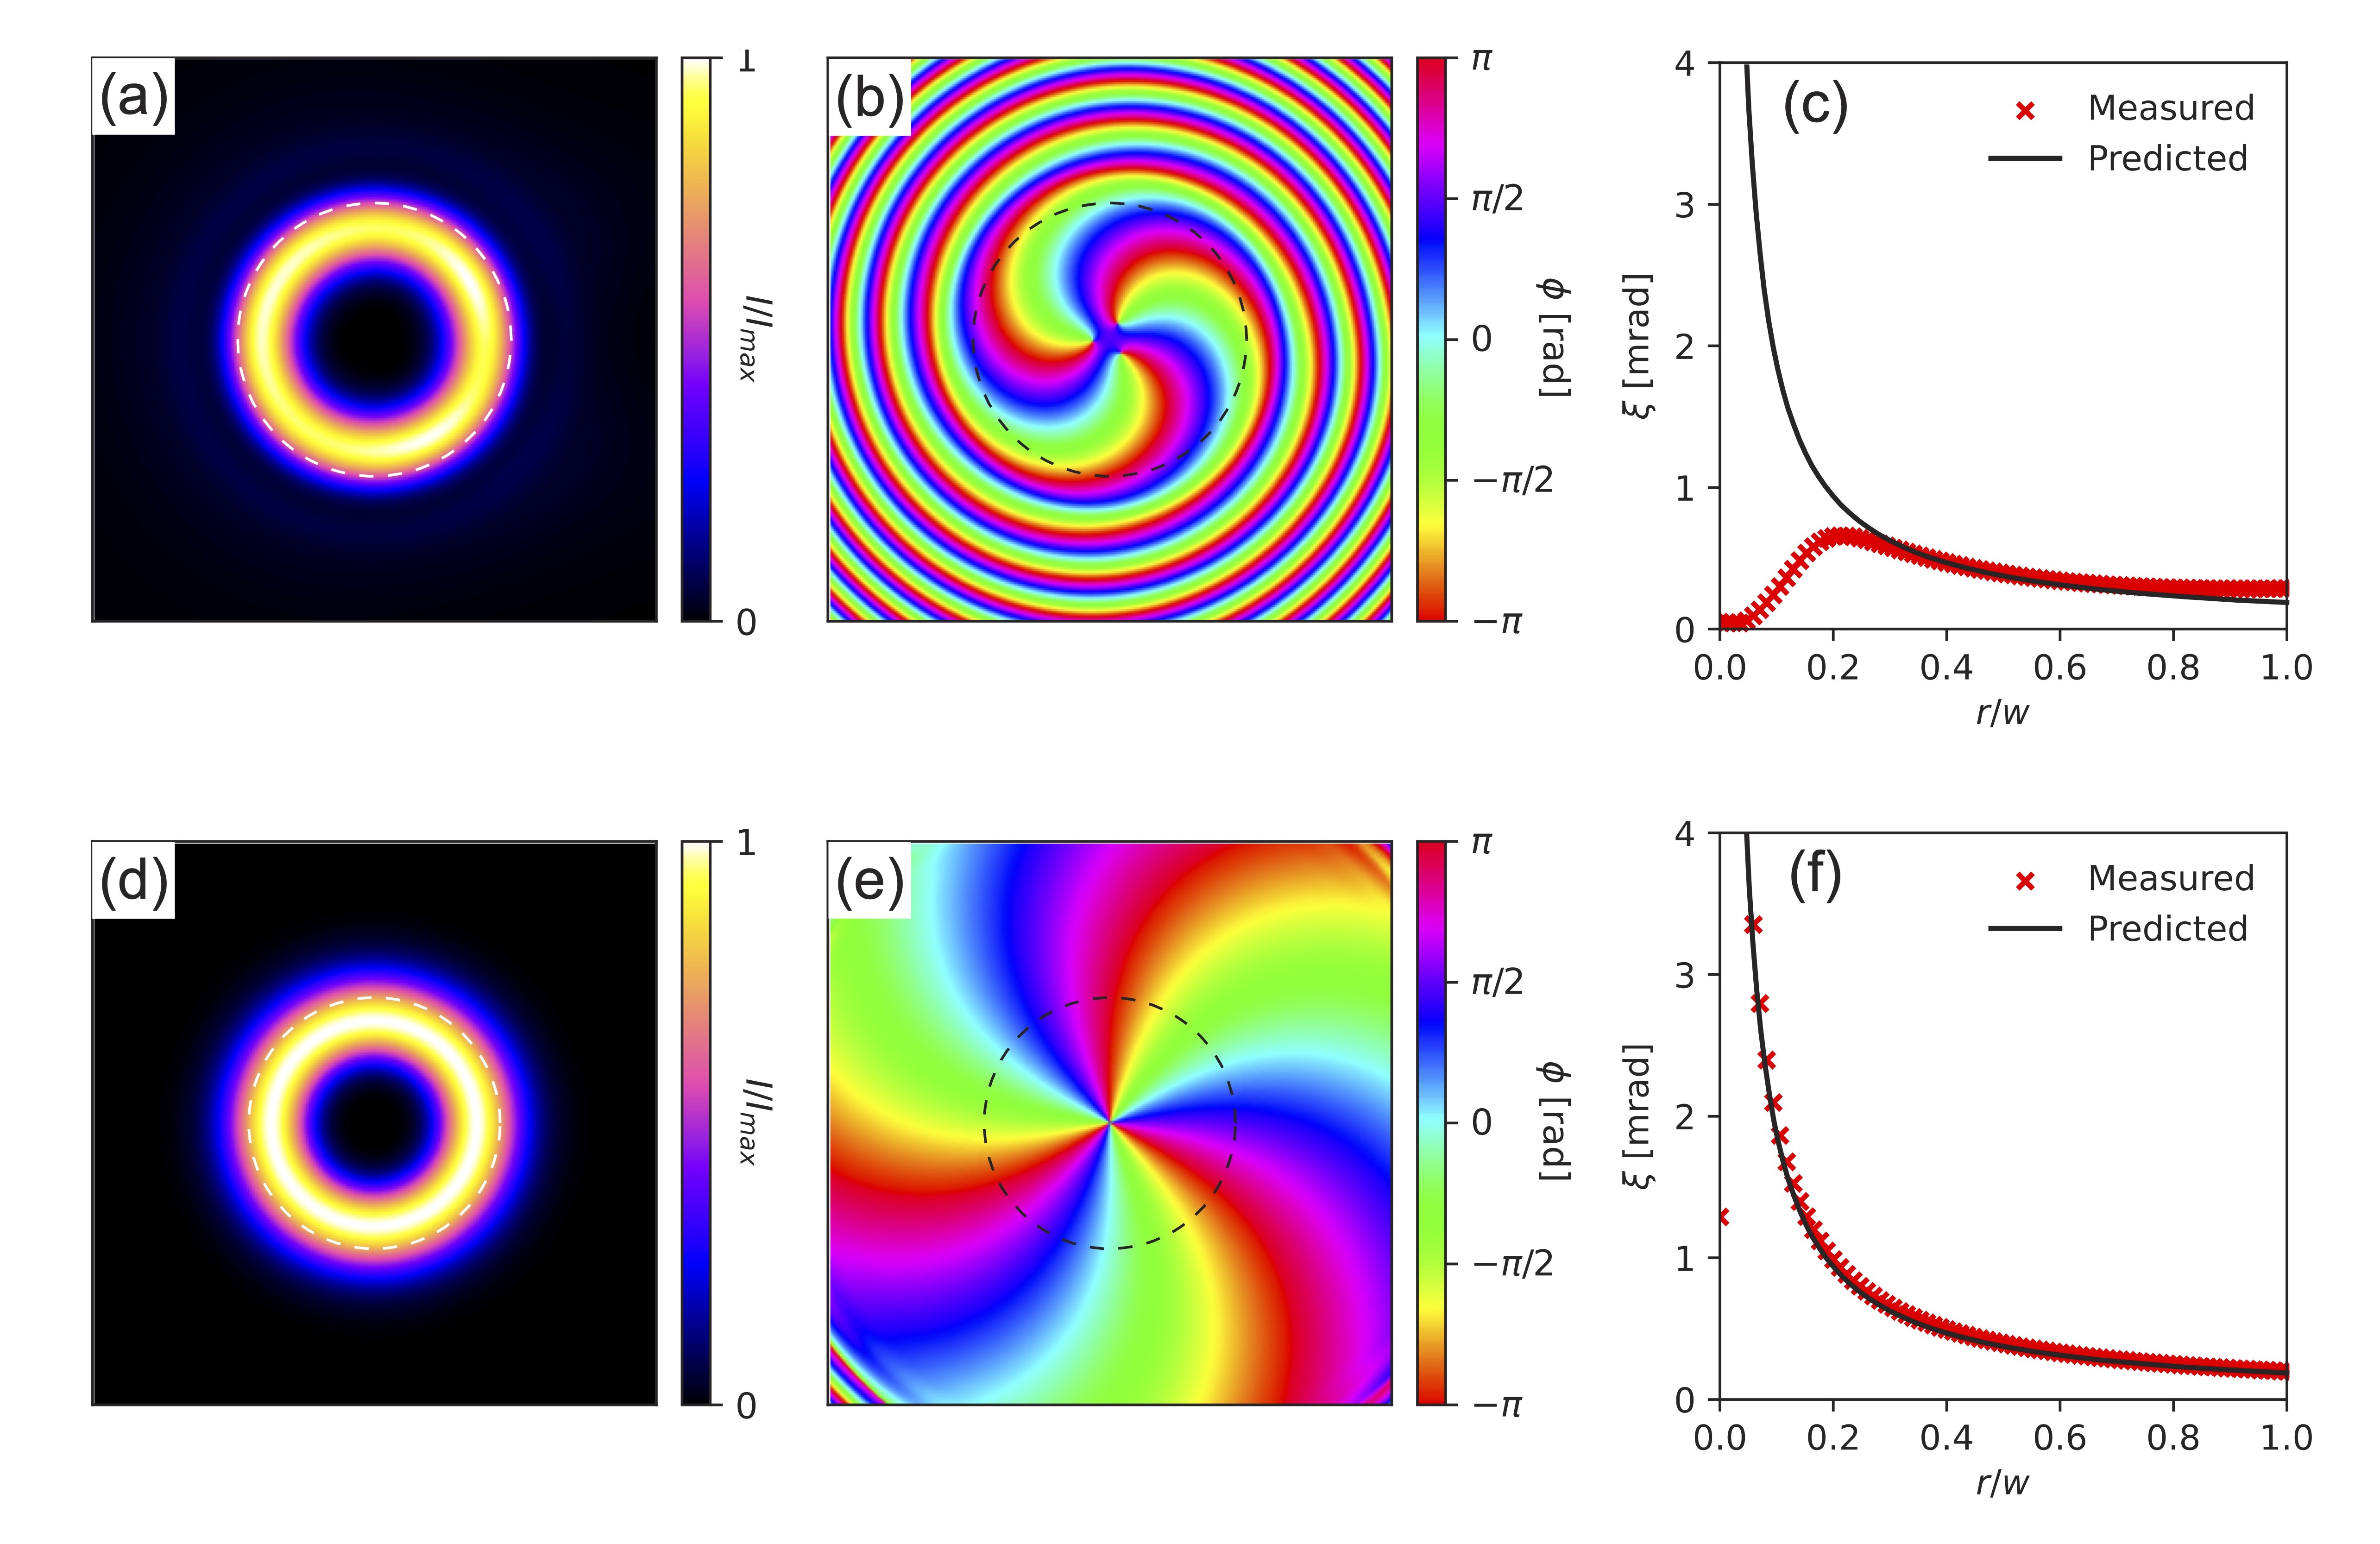
Image taken from Figure 2 of Sontag et al. (2022)
A beam of light can carry OAM in quantities mℏ per photon, for integer m, referred to as the topological charge of the beam. This occurs when each phase front of the beam forms an m-helix, or equivalently, when the phase of the light within a cross section perpendicular to the propagation axis varies from 0 to 2π m times along any path around the propagation axis. In the above figure, panels (b) and (e) show phase cross sections with m=3.
Any configuration of light can be expressed as a linear combination of Laguerre-Gaussian (LG) modes, with radial index p and azimuthal index m. A single such mode carries an OAM topological charge of precisely m. These modes are exact solutions of the paraxial Helmholtz equation, and thus do not mix upon propagation. A single LG mode carries a well-defined topological charge, and has a perfectly localized phase singularity along its beam axis. A nontrivial linear combination of such modes, however, breaks into multiple disjoint phase singularities upon propagation. This breakdown is undesirable for many of the use-cases of OAM beams, including quantum computation.
The goal of our research was to model the production of OAM modes via diffraction of a Gaussian beam off of a holographic grating (a common practice), and then to fine-tune the grating pattern in order to isolate singular LG modes, which can propagate stably. We derived a correction to the standard holographic pattern which can be applied in a number of different ways, and which allows for arbitrarily pure LG mode production with controllable intensity losses.
The figure above shows cross sections of the uncorrected (top row) and corrected (bottom row) outputs of the modeled process described above. The leftmost column is the beam intensity, the middle column is the beam phase, and the rightmost column is the Poynting vector skew angle plotted versus radius.